BI blog spot!

April 8, 2013

27. Number of values passed in a prompt

Filed under: BO Webi — Sharan Chandrasekaran @ 1:02 pm

Sometimes users would like to see the number of values they are passing the query prompt. There is no direct way to do this, but as always we can use webi functions to achieve this. Below is the formula I used :

(Length(UserResponse(“Enter_Val”))) – (Length(Replace(UserResponse(“Enter_Val”);”;”;””))) + 1

“Enter_Val” is the name of the prompt

December 8, 2012

26. Chasm traps and Fan traps

Filed under: BO Designer — Sharan Chandrasekaran @ 8:23 am

Found an easy but interesting article on Chasm and Fan traps. Explained in simple terms how they can be avoided.

Preventing Chasm and Fan Traps!

Thanks to David Lai.

December 6, 2012

25. Informatica Session Logs

Filed under: Informatica — Sharan Chandrasekaran @ 11:10 am

We could see that the session logs in our Informtica Workflows were getting overwritten.
Only the latest session log was available, causing some concerns. There is no way to track what the session processed if the logs are overwritten.

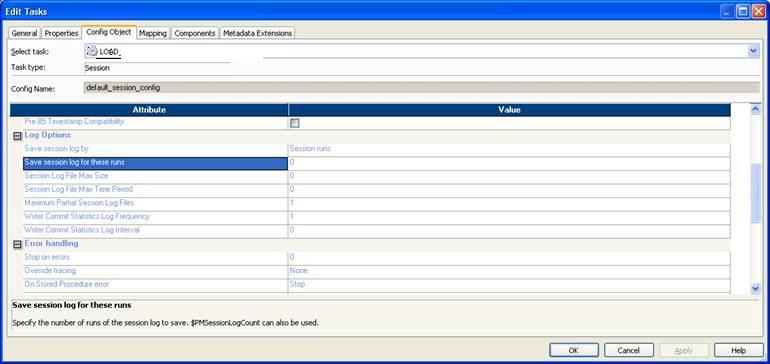
How can this be overcome? Here are the simple steps…

1. From WF manager edit the workflow.
2. Go to session and edit it.
3. From “Config Object” tab, change the “Save Session Logs for these runs” parameter to > 0.

Session

November 22, 2012

24. Using multiple time dimension and fact tables in a universe for optimal performance.

Filed under: BO Designer — Sharan Chandrasekaran @ 11:39 am

Time dimension, is a must in for all universe. No universe can be effectively used without providing the ability to retrieve data based on time – day,week, month,year etc.

So what could be the best data model  / design that can be used so that time dimensions are used effectively! Here is a basic example on how it is usually done in ad-hoc universes.

Use multiple time dimension tables!!

The above figure, is an example how we can effectively use a multiple time dimension tables with the fact tables that are aggregated on various period.

As the name suggets, DLY_BOOK shows facts at day level (in my case i used this for the weekly reporting as well), MTH_BOOK and QTLY_BOOK at month and quarter levels.

We need to have separate time dim tables as in the left.

Now define, the time dimensions in BO,something like below,

  1. Fiscal Year – @Aggregate_Aware(QUARTER_TO_YEAR.FISCAL_YEAR_NUMBER_INT, MONTH_TO_YEAR.FISCAL_YEAR_NUMBER_INT,DAY_TO_YEAR.FISCAL_YEAR_NUMBER_INT)
  2. Fiscal Quarter ID – @Aggregate_Aware(QUARTER_TO_YEAR.DV_FISCAL_QUARTER_ID, MONTH_TO_YEAR.DV_FISCAL_QUARTER_ID,DAY_TO_YEAR.FISCAL_QUARTER_ID)
  3. Fiscal Month ID – @Aggregate_Aware(MONTH_TO_YEAR.FISCAL_YEAR_MONTH_INT, DAY_TO_YEAR.FISCAL_YEAR_MONTH_INT)
  4. Fiscal Week ID – DAY_TO_YEAR.FISCAL_YR_MNTH_WEEK_NUM_IN

Define the measure like below,

Book_Val – @Aggregate_Aware(Sum(QTLY_BOOK.DD_COMP_US_NET_PRICE_AMOUNT),      Sum(MTH_BOOK.DD_COMP_US_NET_PRICE_AMOUNT),                        Sum(DLY_BOOK.DD_COMP_US_NET_PRICE_AMOUNT))

Now, setup the relevant incompatibilities, this will ensure the correct time dimension tables is used along with the aggregated fact tables.

Note : This is one usually scenario where @aggregate_aware is used with the dimension table! @aggregate_aware is explained usually to be used on measure definitions, but this is one scenario where it is used on dimension definitons as well.

Hope this is useful!

May 9, 2012

23. Retrieve data from current table or historical table using aggregate aware

Filed under: BO Designer — Sharan Chandrasekaran @ 11:09 am

This is a common requirement from functional users to speed up performance of queries. Some time when retrieving transaction level data, the query tends to work very slow. There are millions of transactional records making it difficult for users to retrieve data faster. Usually transactional data is analysed for past 2-3 years, however the underlying tables may have more than 5 years of data. When we run a report against this 5 year table it tends to be slow. To overcome this we requested the DBA to create 2 tables one with2 years of data and one with 5 years data. This was done by them.

Now, we need to implement this logic in BO when users need to take 2 years of data it has point to 2 years table, anything pervious to 2 years go to 5 years table. This is how it was implemented,

Step 1 : Create a dummy object with name – “Enable History Data Flag” like below, this will not parse, but its ok. This was created under the GM class that we have.

Step 2 : Create an “Enable History Data” filter object like below on the “Enable History Data Flag” object. Object definition will be like -> @Select(GM\Enable History Data Flag)=’Y

Step 3: Create the dimension object like below, the “Transaction ID” can be picked from one of the 2 tables – TRANSACTION_LINE_DIM (2 years data eg 2011-2012) or TRANSACTION_LINE_ALL_DIM(5 years data 2008-2012)

Object Definition : @Aggregate_Aware(TRANSACTION_LINE_DIM.TRANSACTION_ID,TRANSACTION_LINE_ALL_DIM.TRANSACTION_ID)

Step 4 :Next step, we need to set up the aggregate navigation on the TRANSACTION_LINE_DIM (2 years table) table.

Setup an incompatibility between TRANSACTION_LINE_DIM  and the “Enable History Data Flag” dimension object and “Enable History Data” filter object using aggregate navigation.

Click here to download document with print screens (History_Data_Technique)

April 21, 2012

22. Working days calculation in Web Intelligence

Filed under: BO Webi — Sharan Chandrasekaran @ 3:11 am

Its quite amusing to see that there are no direct way to calculate working days in Webi or most of the reporting tools. We need to do some workarounds to perform this. I found a way to do this (not optimal though) when we just have to remove the Saturdays and Sundays from two date ranges and calculate the date difference. However, I have made an assumption here that the minimum day difference is at least 7 days between the 2 dates. Here are the steps,

1. Calculate days difference using the simple formula

=DaysBetween([Start_Date];[End_Date])

Keep this as [Day_Diff]

2. Calculate the Mod as below,

=Mod([Day_Diff];7)

The formula will give the reminder and what ever is the result is the number of days left out when we try to convert the number of days in to weeks. Name this variable as [Mod]

3. For a whole week of 7 days, we will definitely have 2 holidays (1 Saturday and 1 Sunday). So use the  below formula to calculate absolute number of Saturdays and Sundays for the whole week.

=(([Day_Diff] – [Mod]) / 7) * 2

Name this as [Round_Weeks]

4. Create another Variable – [Day_Name], this will use the formula – DayName([Incident Resolved Datetime]). Basically this variable will contain the Day Name of the date when the record was resolved.

5.Now comes an interesting part, what we need to identify is for the remaining of the days (the result of Mod variable) are we having any Saturdays or Sundays. Use the below variable for this. Name this as [Final_Removal]

=If [Day_Name] = “Monday” And [Mod] = 1 Then 0
ElseIf [Day_Name] = “Monday”And [Mod] = 2 Then 1
ElseIf [Day_Name] = “Monday” And [Mod] = 3 Then 2
ElseIf [Day_Name] = “Monday” And [Mod] = 4 Then 2
ElseIf [Day_Name] = “Monday” And [Mod] = 5 Then 2
ElseIf [Day_Name] = “Monday” And [Mod] = 6 Then 2
ElseIf [Day_Name] = “Tuesday” And [Mod] = 1 Then 0
ElseIf [Day_Name] = “Tuesday” And [Mod] = 2 Then 0
ElseIf [Day_Name] = “Tuesday” And [Mod] = 3 Then 1
ElseIf [Day_Name] = “Tuesday” And [Mod] = 4 Then 2
ElseIf [Day_Name] = “Tuesday” And [Mod] = 5 Then 2
ElseIf [Day_Name] = “Tuesday” And [Mod] = 6 Then 2
ElseIf [Day_Name] = “Wednesday” And [Mod] = 1 Then 0
ElseIf [Day_Name] = “Wednesday” And [Mod] = 2 Then 0
ElseIf [Day_Name] = “Wednesday” And [Mod] = 3 Then 0
ElseIf [Day_Name] = “Wednesday” And [Mod] = 4 Then 1
ElseIf [Day_Name] = “Wednesday” And [Mod] = 5 Then 2
ElseIf [Day_Name] = “Wednesday” And [Mod] = 6 Then 2
ElseIf [Day_Name] = “Thursday” And [Mod] = 1 Then 0
ElseIf [Day_Name] = “Thursday” And [Mod] = 2 Then 0
ElseIf [Day_Name] = “Thursday” And [Mod] = 3 Then 0
ElseIf [Day_Name] = “Thursday” And [Mod] = 4 Then 0
ElseIf [Day_Name] = “Thursday” And [Mod] = 5 Then 1
ElseIf [Day_Name] = “Thursday” And [Mod] = 6 Then 2
ElseIf [Day_Name] = “Friday” And [Mod] = 1 Then 0
ElseIf [Day_Name] = “Friday” And [Mod] = 2 Then 0
ElseIf [Day_Name] = “Friday” And [Mod] = 3 Then 0
ElseIf [Day_Name] = “Friday” And [Mod] = 4 Then 0
ElseIf [Day_Name] = “Friday” And [Mod] = 5 Then 0
ElseIf [Day_Name] = “Friday” And [Mod] = 6 Then 1
ElseIf [Day_Name] = “Saturday” And [Mod] = 1 Then 1
ElseIf [Day_Name] = “Saturday” And [Mod] = 2 Then 1
ElseIf [Day_Name] = “Saturday” And [Mod] = 3 Then 1
ElseIf [Day_Name] = “Saturday” And [Mod] = 4 Then 1
ElseIf [Day_Name] = “Saturday” And [Mod] = 5 Then 1
ElseIf [Day_Name] = “Saturday” And [Mod] = 6 Then 1
ElseIf [Day_Name] = “Sunday” And [Mod] = 1 Then 1
ElseIf [Day_Name] = “Sunday” And [Mod] = 2 Then 2
ElseIf [Day_Name] = “Sunday” And [Mod] = 3 Then 2
ElseIf [Day_Name] = “Sunday” And [Mod] = 4 Then 2
ElseIf [Day_Name] = “Sunday” And [Mod] = 5 Then 2
ElseIf [Day_Name] = “Sunday” And [Mod] = 6 Then 2

6. Final work days calculation will be below,

=[Day_Diff][Round_Weeks][Final_Removal]

Hope this helps, if you find any flaws in this approach, please let me know. I have tested for a few  values and it looks to be working fine!!!!

P.S: I used this concept to find the working days between a service record create date and resolve date.
February 16, 2012

21. Frequently used Webi Reporting Functions

Filed under: BO Webi — Sharan Chandrasekaran @ 12:04 pm

There are a number of Webi functions providing various uses. However, from my experience I have seen users requiring reports with some requirement and the below list of functions have always been very handy.

1. DaysBetween
2. RelativeValue
3. Match – You can use it for an exact match of wildcard match.
4. Replace
5. ToDate, ToNumber
6. LineNumber, ColumnNumber , RowIndex
7. UserResponse
8. NoFilter
9. DrillFilter
10.ForceMerge
11.Trim
12.Rank – Using this with the reset dimension is very useful.

February 6, 2012

20. Create a recent 5 week trend report

Filed under: BO Webi — Sharan Chandrasekaran @ 12:04 pm

his is an usual scenario we face in many BO reports. There was a requirement to add a table that shows the sales trend of 5 (latest) weeks alone along with some labels that identifies that this is current week , 1 week previous etc. The report retrieves all data for the current quarter.

How can we do this? Here is one of the work arounds,

1. First convert the week name from a string format in to numerical format.

ToNumber(Replace(Replace(Replace(Replace(Trim([Fiscal Week Name]);”FY”;””);” Q”;””);” “;””);”WK”;””))

Fiscal Week Name has a format something like this – “FY2012 Q3 WK01”. The replace function used is not very dynamic, however the week name format is always the same.

Note: this step may not be required in many of the BO implementations that provides weekid (a number) is given along with the fiscal week name.

2. Create another formula something like below

=If(Max([Week_Number]) In Report – [Week_Number]) = 0 Then “Current WeeK” ElseIf (Max([Week_Number]) In Report – [Week_Number]) = 1 Then “1 Week Before”
ElseIf (Max([Week_Number]) In Report – [Week_Number]) = 2 Then “2 Weeks Before” ElseIf (Max([Week_Number]) In Report – [Week_Number]) = 3 Then “3 Weeks Before”
ElseIf (Max([Week_Number]) In Report – [Week_Number]) = 4 Then “4 Weeks Before”

3. Create a table including the formula in step 2 and filter it based on the 5 values, that is Current Week, 1 Week Before etc.

January 19, 2012

19. Rank function with reset dimension

Filed under: BO Webi — Sharan Chandrasekaran @ 11:23 am

Recently, our user had asked for a simple rank report that showed the Rank in ascending order.

The rank should be based on the sales value & partners, but specific to the country. for eg, if there are 10 partners in a country theie sales should be ranked independently from 1-10. Other partners in a different country should be given separate ranks.

The Rank function has a reset dimension parameter, that helps us to get to this very easily.

It has below syntax,

=Rank([Total_Sales];Top;([Country Name]))

Top – refers that the rank will applied in ascending order.

[Country Name] – this is reset dimension.

January 17, 2012

18. Informatica Transformation Types (PowerCenter 9.0.1)

Filed under: Informatica — Sharan Chandrasekaran @ 6:42 am

PowerCenter 9.0.1 provides 28 objects for data transformation

Aggregator: performs aggregate calculations
Application Source Qualifier: reads Application object sources as ERP
Custom: Calls a procedure in shared library or DLL
Data Masking: Replaces sensitive data with realistic test data
Expression: performs row-level calculations
External Procedure (TX): calls compiled code for each row

Filter: drops rows conditionally
HTTP: connects to HTTP server to read or update data
Input: Defines mapplet input rows. Available in Mapplet designer
Java: Executes java code
Joiner: joins heterogeneous sources
Lookup: looks up values and passes them to other objects

Normalizer: reads data from VSAM and normalized sources
Output: Defines mapplet output rows. Available in Mapplet designer
Rank: limits records to the top or bottom of a range
Router: splits rows conditionally
Sequence Generator: generates unique ID values
Sorter: sorts data

Source Qualifier: reads data from Flat File and Relational Sources
SQL: Executes SQL queries against the database
Stored Procedure: calls a database stored procedure
Transaction Control: Defines Commit and Rollback transactions
Union: Merges data from different databases
Unstructured Data: Transform unstructured data and semi-structured formats

Update Strategy: tags rows for insert, update, delete, reject
XML Generator: Reads data from one or more Input ports and outputs XML through single output port
XML Parser: Reads XML from one or more Input ports and outputs data through single output port
XML Source Qualifier: reads XML data

Older Posts »

Blog at WordPress.com.